Daily Leverage Certificates
DLC Hotline: (65) 6226 2828
Silicon Valley Bank is taken over by California regulator after a run on deposits; US bank stocks plunge. There could be spillover effects on the tech and financial sectors. DJIA dumps into the worst close year-to-date.
● China ECommerce Logistics Index printed 107.2 in February 2023, up 2.6 points over January.
● Swiss Banks are preparing for potential sanctions against China, looking for ways to protect Chinese clients.
● The Netherlands confirmed for the first time that it reached an agreement with the US and Japan to restrict export of chip manufacturing equipment to China.
● Tesla is looking for Chinese and South Korean manufacturers for its 4680 battery.
● BOJ Governor Kuroda defended the dovish policies during his term in his final meeting. He will step down on 08 April and be replaced by Kazuo Ueda.
● Iran and Saudi Arabia restore ties in a deal brokered by China.
● Audi Ceo Duesmann visits China; new plant in Jilin Province to produce only electric vehicles.
Hang Seng Index closed this week at 19282, down 1248 points or 6.07%. Price action confirms overhead resistance by short term 10, 20 and 50 Day SMAs. End-of-week close directly cut through potential supports at 20000 and 19450. Next look out for potential support if any from the confluence of 100 and 150 Day SMAs (red and yellow below). Note that these averages have performed a golden cross this week which is a signal for a bullish reversal. A good signal is usually accompanied or verified by base building with the moving averages as support, followed by a higher move. Should the index continue fall beyond the 100 and 150 Day, such a setup could be associated with further losses with the HSI potentially visiting its October 2022 low in the 14000s region.
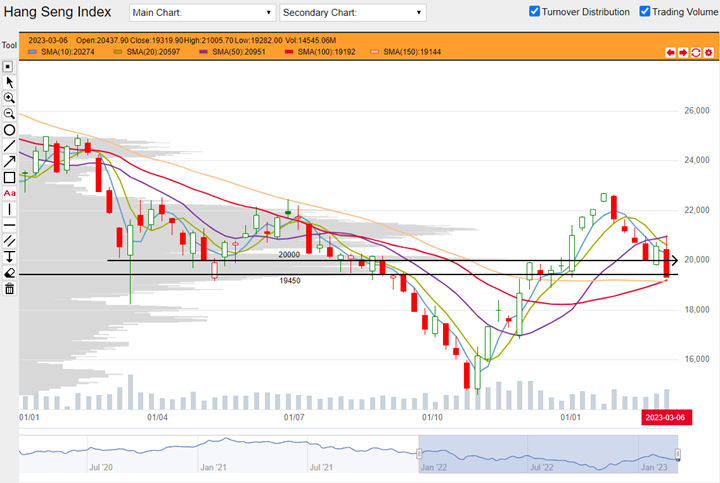
HSI weekly chart from 03 January 2022 to 10 March 2023 (Source: DLC.socgen.com)
Hang Seng Tech closed the week at 3782, down 429 points or 10.19%. End-of-week close fell directly below potential support level and cut through both 100 and 150 Day SMAs. This setup is usually associated with further losses. Next potential support is 3500 followed by the previous low printed in October last year. 100 and 150 Day SMAs are converging for a golden cross so should HSTech move back above 4000, that would be a positive setup for a potential bullish reversal. At this current level however, both 100 and 150 SMAs as well as the region between 4000 and 4120 have become potential resistance.
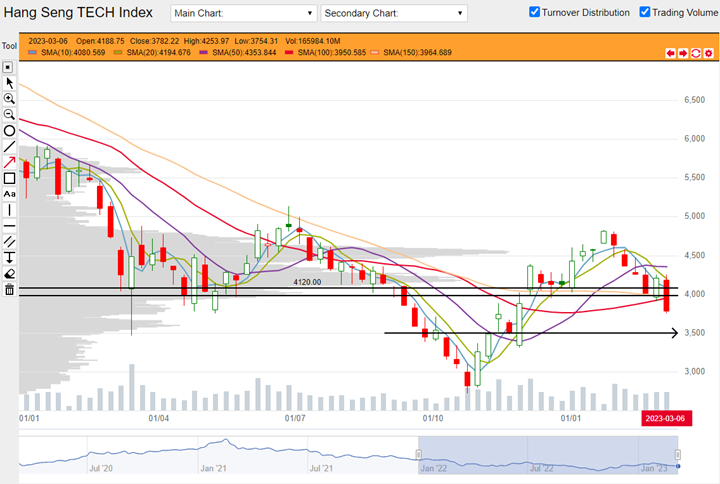
HSTech weekly chart from 03 January 2022 to 10 March 2023 (Source: DLC.socgen.com)
Dow Jones Industrial Average closed the week at 31910, down 1481 points or 4.44%. This week was the worst performing week and the worst year-to-date close. DJIA closed below its entire basket of moving averages, a setup associated with further losses. Out of 30 components, only Apple, Intel and Merck closed the week positive. Nasdaq closed the week at 11830, down 461 points or 3.75%. It closed above its 50, 100 and 150 Day SMAs which offers potential support for price action next week.
The next FOMC meeting is scheduled on 22 March 2023. Probability of a 50 basis point hike rose steadily since the last but this trend was reversed this week possibly by trouble in the banking and finance sector.
Fed funds futures on rate hike probability by next Fed meeting as at last DLC commentary on 03 March:
● 69.4% probability of 25 basis points rate hike | 30.6% probability of 50 basis points hike
Fed funds futures on rate hike probability by next Fed meeting at this week’s reading:
● 60.5% probability of 25 basis points rate hike | 39.5% probability of 50 basis points hike
Shanghai Composite closed the week at 3230, down 98 points or 2.68%. This is the worst weekly performance since the beginning of the year but the index closed above its Q4 2022 high of 3226 which is still a positive setup. Overhead lies its 10 and 20 Day SMAs while the 50, 100 and 150 indicators sit below. It is possible that the Shanghai Composite was held aloft by positive vibes from the second plenary session of the 20th CPC in China but this week, headlines suggest that there is a price war in the EV sector which was dampening the mood. The Shenzhen Index closed at 11443, down 409 points or 3.45%. Shenzhen Index is less exuberant, having peaked back at the end of January and was leaking steadily since. It closed below Q4 2022 high at 11511. It also closed below its 10, 20, 50 and 150 Day SMAs.
Economic data in coming week:
1. Tuesday 14 March 2023 US reports CPI, Core CPI.
2. Wednesday 15 March 2023 China reports Retail Sales y-on-y.
3. Wednesday 15 March 2023 UK releases Annual Budget.
4. Wednesday 15 March 2023 US reports PPI, Retail Sales, Empire State Manufacturing Index.
5. Thursday 16 March 2023 EU Monetary Policy Statement and press conference.
6. Friday 17 March 2023 US reports preliminary UoM Consumer Sentiment.
Other news:
● China Mobile and CNOOC made 52-week highs.
● Alipay reportedly applied for a patent for palmprint recognition device.
● Baidu previously announced that its Ernie Bot will be launched on 16 March 2023 but reportedly basic functions have not been completed yet.
● Tencent’s NFT platform Huanhe to shut on 30 June 2023.
● News headlines report “price war” in the Chinese EV market; leader BYD offers discounts.
● Meituan pulled the plug on its ride-hailing app Meituan Dache; founder Wang Xing plans to invest in co-founder’s AI startup.
● Sino Biopharmaceutical completed its acquisition of Nasdaq-listed F-Star Therapeutics.
Technical observations
Ganfeng Lithium 1772.hk forms a horizontal channel, the good and the bad.
Note chart features:
1. Ganfeng Lithium is printing out a horizontal channel. Based on swing highs, overhead resistance is between $70.25 to $76.25. Based on swing low, support could be found between $49.90 to $52.25. $49.90 is the lowest traded price of 2022. $52.25 is the lowest end-of-week close.
2. Should Ganfeng be able to consolidate at the current channel followed by a higher swing high eventually, the current price pattern could be seen as a bullish reversal pattern. Should the stock break below $49.90, the setup would be associated with further losses.
3. Moving average indicators agree with the observations above. Averages are now converging which indicates the previous downtrend is slowing and could reverse but this setup is equally valid during horizontal movement. If price continues lower then the moving averages could switch to resistance role and the whole downward setup could be interpreted as a continuation of 2022 downtrend.
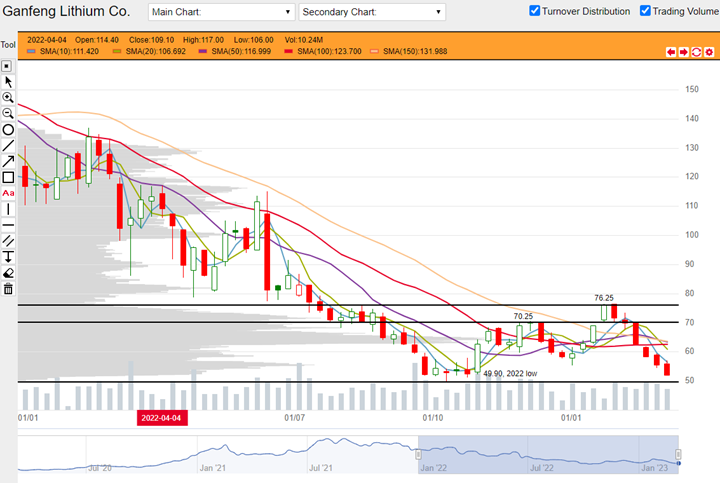
Ganfeng Lithium 1772.hk weekly chart from 03 January 2022 to 10 March 2023 (Source: DLC.socgen.com)
Xiaomi 1810.hk moving averages make golden cross, symmetry for right shoulder.
Note chart features:
1. 100 and 150 Day SMAs converge to print a golden cross which is a bullish reversal signal. This has to be confirmed. Price action has to show that the same moving averages can become support for price to build base for a higher move. Coincidentally, Xiaomi has the symmetry to make a potential inverted right shoulder.
2. Bullishness depends on support from a zone between $10.80 - 11.04 drawn from previous swing low. 100 and 150 Day SMA coincides at this zone. If price breaks below and cuts the moving averages as well, the setup becomes a bearish continuation pattern. Next potential support expected at $8.60 but needs confirmation from price action.
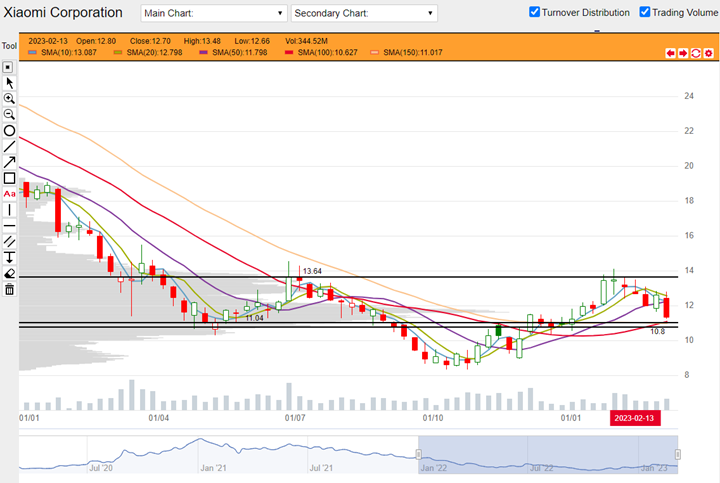
Xiaomi 1810.hk weekly chart from 03 January 2022 to 10 March 2023 (Source: DLC.socgen.com)
Underlying Index/Stock |
Underlying Chg (%)1 |
Long DLC (Bid Change%2) |
Short DLC (Bid Change%2) |
|---|---|---|---|
| Hang Seng Index (HSI) | -1.87% | RQGW (-11.31%) | WIEW (+11.72%) |
| Hang Seng TECH Index (HSTECH) | -3.26% | ECJW (-8.53%) | Y9GW (+11.30%) |
| Ganfeng Lithium Co. (1772.HK) | -1.15% | Y4GW (0.00%) | |
| Xiaomi Corporation (1810.HK) | -3.85% | DKRW (-19.88%) | SLRW (+21.23%) |
Brought to you by SG DLC Team
This advertisement has not been reviewed by the Monetary Authority of Singapore. This advertisement is distributed by Société Générale, Singapore Branch. This advertisement does not form part of any offer or invitation to buy or sell any daily leverage certificates (the “DLCs”), and nothing herein should be considered as financial advice or recommendation. The price may rise and fall in value rapidly and holders may lose all of their investment. Any past performance is not indicative of future performance. Investments in DLCs carry significant risks, please see dlc.socgen.com for further information and relevant risks. The DLCs are for specified investment products (SIP) qualified investors only.
Full Disclaimer - here